Telemetry
The Telemetry tab displays door activity and temperature trends over a selected time period. This helps monitor equipment performance, usage patterns, and cooling consistency.
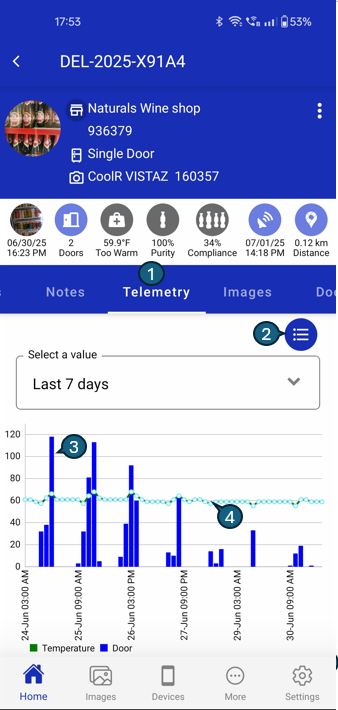
Chart View
List View Sections
1. Telemetry Tab
Highlights the selected tab displaying telemetry data, including real-time and historical information about door activity and temperature trends. When this tab is active, users can view interactive charts and detailed summaries that help them analyze equipment usage, monitor cooling performance, and quickly identify any irregularities or patterns over the chosen time period.
2. Chart Toggle Icon
Tap to switch between chart view and summary list view.
3. Door Count Bars
Blue vertical bars represent the number of door openings for each day within the selected time range. Each bar's height corresponds to the total door activity recorded on that specific date, making it easy to spot days with higher or lower usage at a glance.
4. Temperature Line
A dotted line overlays the chart to represent the average temperature trend throughout the selected period. This line provides a visual reference for how the temperature fluctuates day by day, making it easy to identify periods of stable cooling or detect any unusual temperature variations. By comparing the dotted line with the door count bars, users can correlate temperature changes with door activity and quickly spot any anomalies in equipment performance.
Use this screen to observe spikes in usage and identify cooling irregularities.
List View
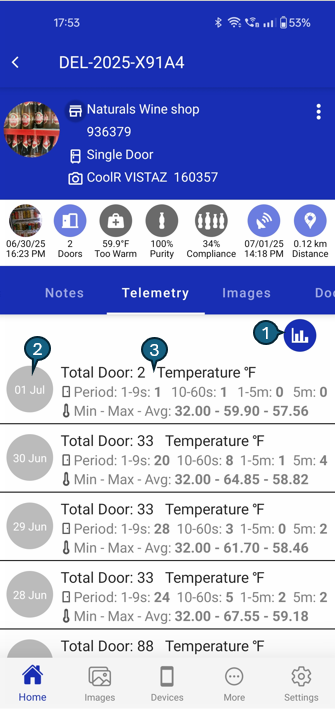
1. View Toggle
Tap this icon to switch between the summary list view and the chart view. When in list view, tapping the icon returns you to the interactive chart, allowing you to easily compare daily statistics with visual trends. This toggle helps you seamlessly move between detailed data summaries and graphical representations, making it easier to analyze equipment performance from different perspectives.
2. Date Indicator
Displays the specific date for which the telemetry data is summarized on each card. This indicator helps users quickly identify the day associated with the displayed statistics, making it easier to review historical trends, compare daily performance, and correlate events or anomalies with particular dates. Each summary card is clearly labeled, ensuring users can efficiently navigate and analyze equipment activity over time.
3. Summary Card
Each summary card provides a comprehensive snapshot of equipment activity for a specific day. It displays:
- Total Door Openings: The number of times the door was opened, helping you gauge usage intensity.
- Door Data Periodic: The total duration the door was open during the day, categorized as follows:
- 1-9 seconds: 20 occurrences
- 10-60 seconds: 10 occurrences
- 1-5 minutes: 5 occurrences
- 5 minutes and above: 4 occurrences
- Temperature Readings: Minimum, maximum, and average temperatures recorded throughout the day, allowing you to monitor cooling consistency and spot any temperature fluctuations.
These details help users quickly assess daily performance, identify patterns, and detect any operational issues that may require attention.